Question Title
Can the graduated range of a continuous shaft be adjusted as close to the data range as possible?
Problem Description
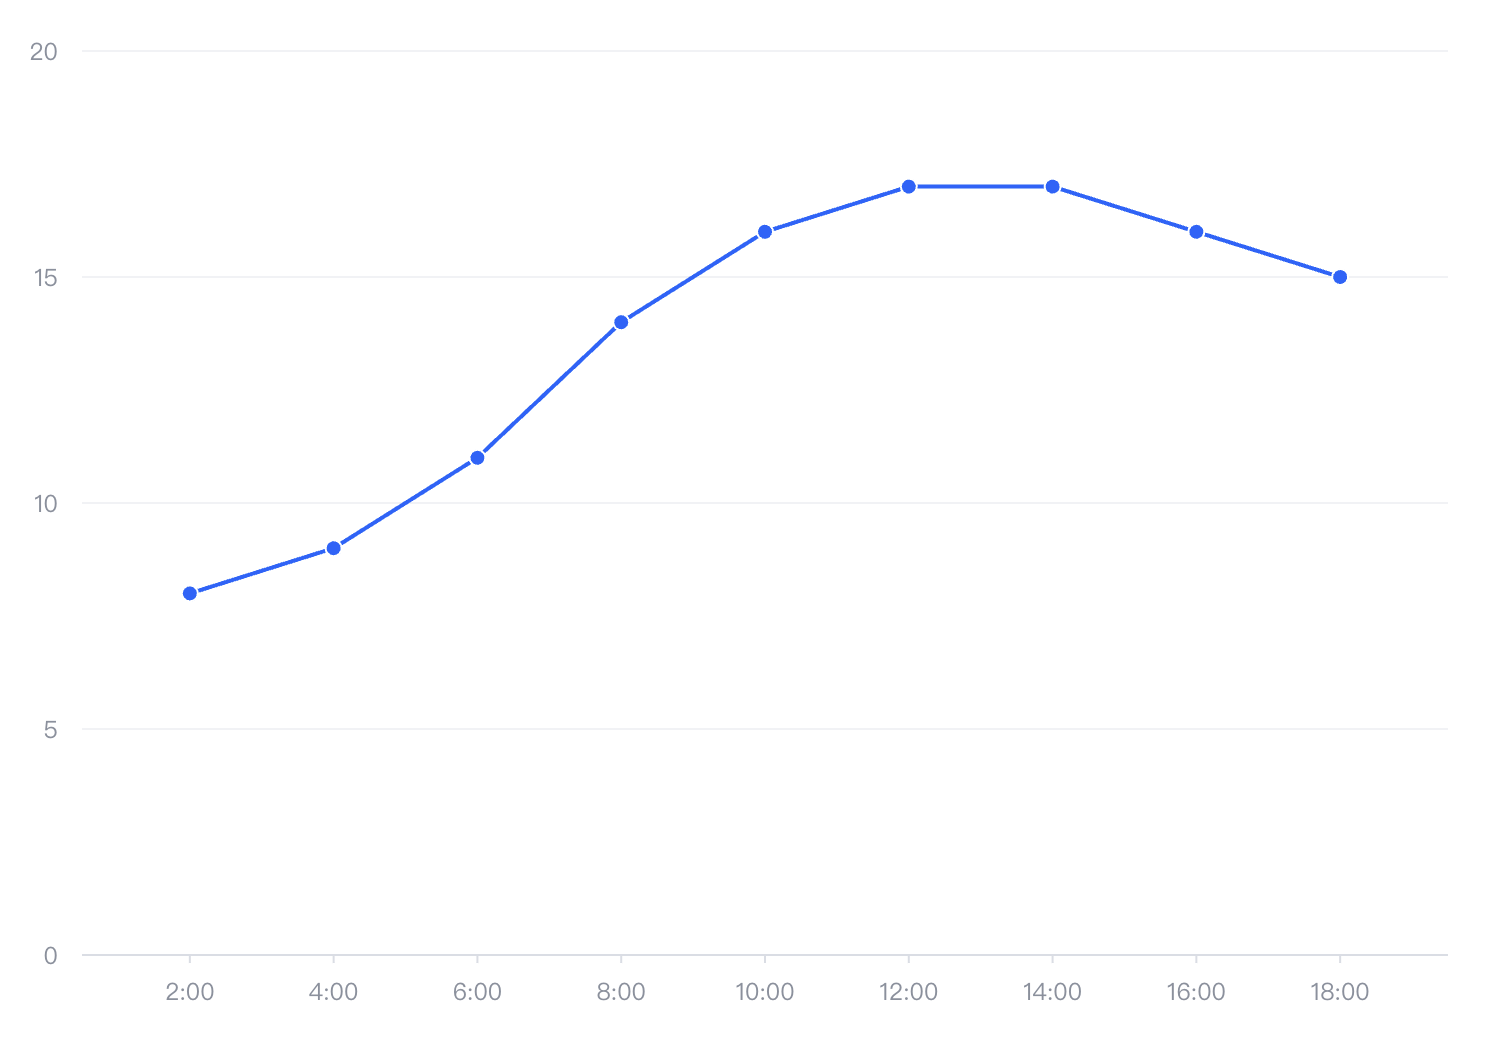
In the following line graph, the scale range of the continuous axis is much larger than the actual data range. Can it be configured to make the scale range closer to the data range?
Solution
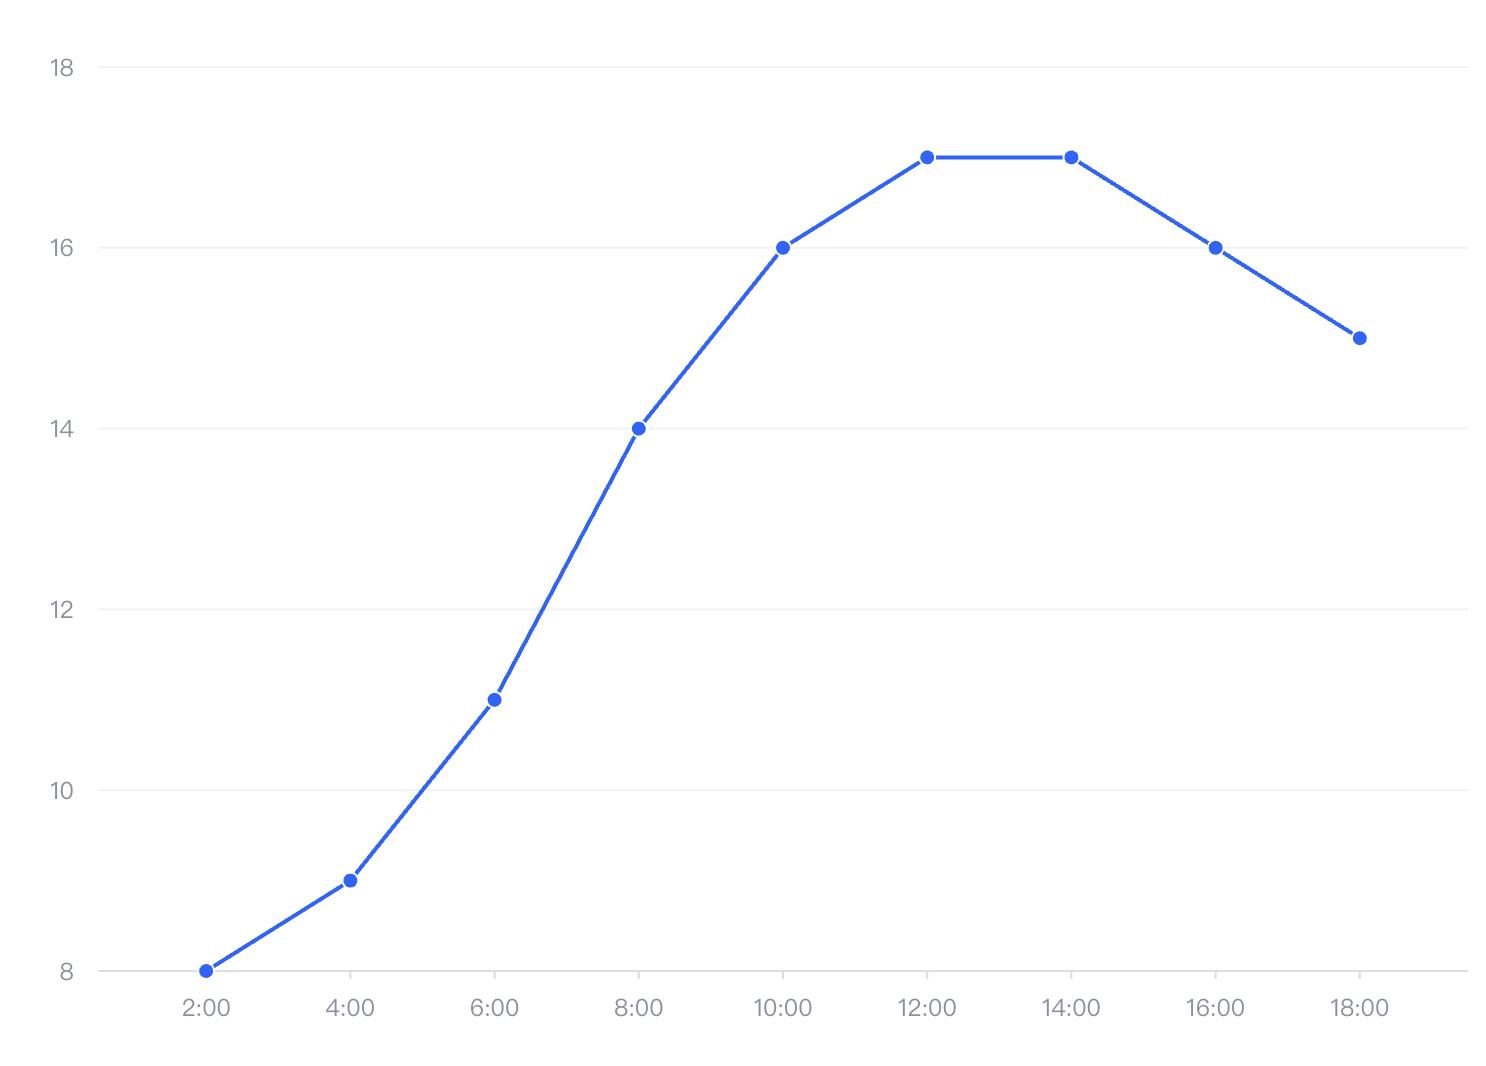
The continuous axis tick algorithm is calculated based on a series of rules, where the axis tick range and the actual data range are also indicators. If you need to further optimize the axis tick range, there are two optimization points:
- The tick can be adjusted not to be forced to start from 0 by using
zero: false - The tick algorithm can be considered to switch to the d3 algorithm. The d3 tick algorithm is better in ensuring data range.
axes: [{
    orient: 'left',
    tick: {
      tickMode: 'd3'
    },
    zero: false
  }]</br>
Code Examples
const spec = {
  type: 'line',
  data: {
    values: [
      {
        time: '2:00',
        value: 8
      },
      {
        time: '4:00',
        value: 9
      },
      {
        time: '6:00',
        value: 11
      },
      {
        time: '8:00',
        value: 14
      },
      {
        time: '10:00',
        value: 16
      },
      {
        time: '12:00',
        value: 17
      },
      {
        time: '14:00',
        value: 17
      },
      {
        time: '16:00',
        value: 16
      },
      {
        time: '18:00',
        value: 15
      }
    ]
  },
  xField: 'time',
  yField: 'value',
  axes: [{
    orient: 'left',
    tick: {
      tickMode: 'd3'
    },
    zero: false
  }]
};</br>
Result Presentation